Data-Science-Portfolio
This project is maintained by VallabhReddy
Welcome to Vallabh’s Portfolio
This website exists primarily to share my data science projects and learnings with anyone who’s willing to listen to my ramblings, but it may evolve over time. You may contact me through my Linkedin Profile or by mail at vallabh.reddyb@gmail.com.
About Me
My name is Vallabh Reddy. I’m a Data Scientist and developer with a penchant for cognitive stimuli. I’ve worked in Data Science, ML, and consulting for around 8 years. I’m a supply chain SME with 5 years of work at Amazon’s global exports division under my belt where I helped the company realize operating efficiencies and cost saving opportunities through the use of ML techniques and statistical simulations.
I play squash, strategy games, and built my own PC. I love reading up on natural and man-made systems like the economy and what makes them tick.
Portfolio
Below is a list of complete and ongoing public Data Science projects of mine.
- Apparel Image Classification using Convolutional Neural Networks
- Multilingual Toxic Comments Classification with only English training data - RoBERTa NLP Transformer
- USA Foreign Trade Analysis
- Kickstarter Campaign Success Prediction
1. Apparel Image Classification using Convolutional Neural Network
Github does not represent certain features of a jupyter notebook well, such as the intra notebook anchors, so here’s a link to open the notebook through NBViewer.
Here is the Github link for the same notebook.
Introduction
The internet has only been getting more expansive. And this expanse brings unstructured data, like images. These are difficult to organize because the subjects in an image are not readily interpretable by machines. But deep learning innovation has picked up momentum and it is much easier to build models which are able to make sense of image data and classify their contents.
The objective of this project was to build an image classifier that could recognize the category of apparel in the photo fed into it. Something that would be of import to online retailers who are flooded with swarms of images from their 3rd party seller or from the customers reviewing the product. This technology could inspect the image to confirm that the image does contain the product itself or a part of the product, otherwise the image could be flagged and inspected for irrelevance.
Dataset
The model is trained and tested on the Fashion MNIST dataset. The dataset is provided by the research branch of Zalando, a European e-commerce company. The dataset is made up of 28x28 grayscale images of 10 categories of apparel. There are 60,000 observations in the training set and 10,000 observations in the test set. The mapping for the 10 categories of apparel is given below.
| Label | Description |
|---|---|
| 0 | T-shirt/top |
| 1 | Trouser |
| 2 | Pullover |
| 3 | Dress |
| 4 | Coat |
| 5 | Sandal |
| 6 | Shirt |
| 7 | Sneaker |
| 8 | Bag |
| 9 | Ankle boot |
Here’s a look at a few sample images.
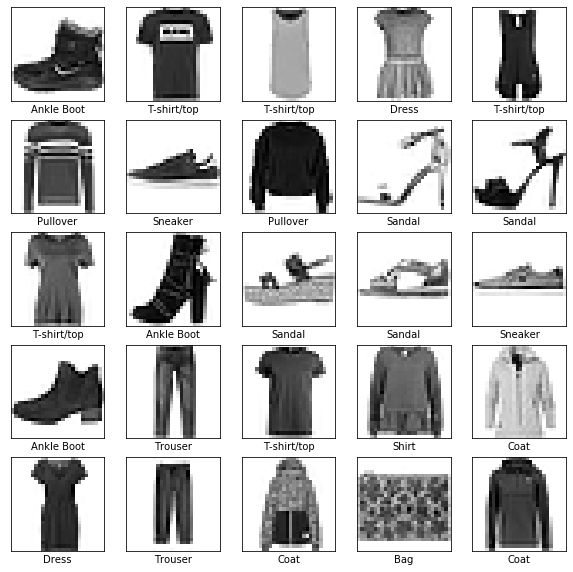
Sample Images
The dataset has no data quality issues and each category has an equal number of observations.
Methodology
Using Keras for Python, the model is built of Convolutional Neural Networks(CNN) which are especially effective in image comprehension. This is because each neuron in these Convolutional layers have a component called kernel which is trained to look for certain patterns in the image, and pass the output called feature map on to the next layer to be built upon. In this way, layer after layer the patterns that the network can detect get more complex.
Let’s take a look at kernels from the first Convolutional layer.
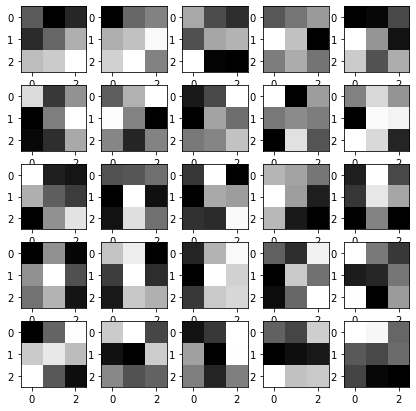
1st Convolutional Layer Kernels
We can see that these are not too complicated, they are usually straght lines or an unintelligible colleciton of pixels. Let us take our first image, which is a shirt and then look at the feature maps that neurons from the first convolutional layer.
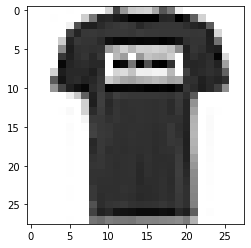
Sample Shirt Image
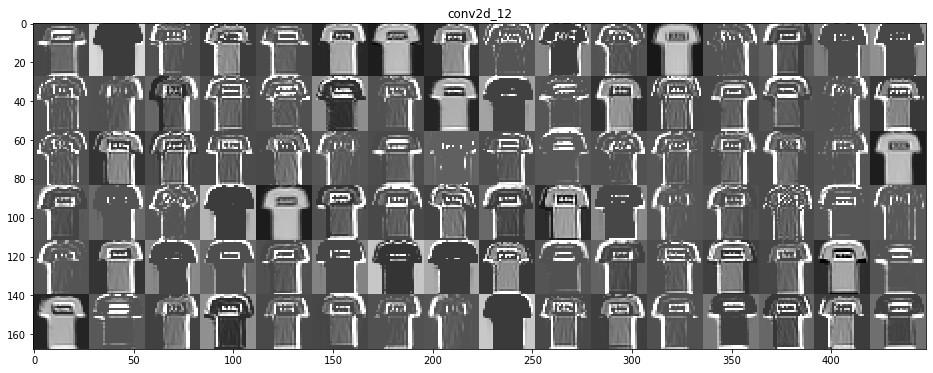
Feature maps of the 1st Convolutional layer
In certain images the vertical sides of the shirt are emphasized whereas in others, horizontal bottoms and tops are focused.
We mentioned earlier that as we get into deeper layers, the activation patterns change. So let’s look at the 4th layer.
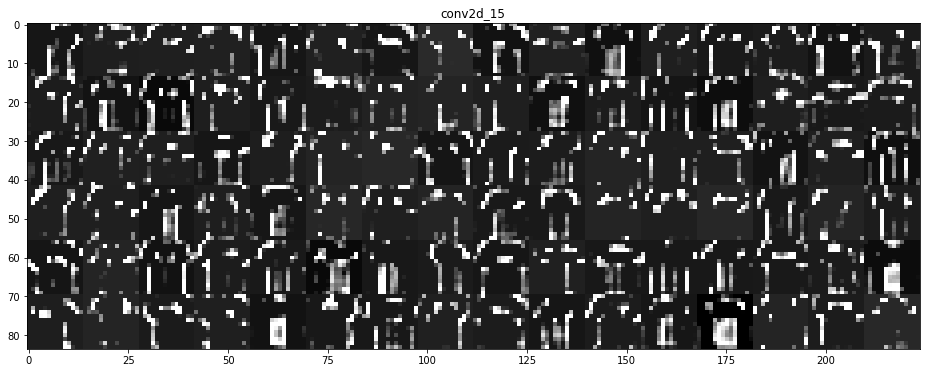
Feature maps of the 4th Convolutional layer
We can see that the activations are much more abstract here. It might make sense that in order to differentiate apparel categories of different shapes, the network learns to look for a collection of abstract features subtle enough to differentiate each other.
The notebook contains several architectures of CNNs and their performance is compared. I used the GPU implementation of TensorFlow since this increases the speed of deep learning model training exponentially, but the drawback is that the results are not perfectly reproducible and setting a seed does not work for the randomizing operations performed by the GPU.
Results
I was able to achieve a 91-93% accuracy of classifications on the test set using a 13 layer network.
2. Multilingual Toxic Comments Classification
This project was a kaggle submission, and can be found here
Introduction
The Conversation AI team, a research initiative founded by Google and Jigsaw, is tasked with improving the vigilance against online toxicity in conversation. The goal of this competition is to be able to identify the toxicity of multilingual comments using only English comments as our training data.
Excerpts from the competition are given below.
It only takes one toxic comment to sour an online discussion. The Conversation AI team, a research initiative founded by Jigsaw and Google, builds technology to protect voices in conversation. A main area of focus is machine learning models that can identify toxicity in online conversations, where toxicity is defined as anything rude, disrespectful or otherwise likely to make someone leave a discussion. If these toxic contributions can be identified, we could have a safer, more collaborative internet.
In the previous 2018 Toxic Comment Classification Challenge, Kagglers built multi-headed models to recognize toxicity and several subtypes of toxicity. In 2019, in the Unintended Bias in Toxicity Classification Challenge, you worked to build toxicity models that operate fairly across a diverse range of conversations. This year, we’re taking advantage of Kaggle’s new TPU support and challenging you to build multilingual models with English-only training data.
Jigsaw’s API, Perspective, serves toxicity models and others in a growing set of languages (see our documentation for the full list). Over the past year, the field has seen impressive multilingual capabilities from the latest model innovations, including few- and zero-shot learning. We’re excited to learn whether these results “translate” (pun intended!) to toxicity classification. Your training data will be the English data provided for our previous two competitions and your test data will be Wikipedia talk page comments in several different languages.
As our computing resources and modeling capabilities grow, so does our potential to support healthy conversations across the globe. Develop strategies to build effective multilingual models and you’ll help Conversation AI and the entire industry realize that potential.
Disclaimer: The dataset for this competition contains text that may be considered profane, vulgar, or offensive.
Datasets
We are given the following datasets.
Training set 1
An all English dataset.
| Column | Description |
|---|---|
| Comment_text | Contains the string that represents the comment. |
| Toxic | A boolean value, 1 = toxic, 0 = non-toxic. |
Training set 2
An all English dataset.
| Column | Description |
|---|---|
| Comment_text | Contains the string that represents the comment. |
| Toxic | A value between 0 and 1 representing the probability of the comment being toxic. |
Validation Set
Has a few languages aside from English.
| Column | Description |
|---|---|
| Comment_text | Contains the string that represents the comment. |
| Toxic | A boolean value, 1 = toxic, 0 = non-toxic. |
| Lang | Two letter representation of the language of the comment. 'es'= Espaniol, 'it' = Italian etc. |
Test Set
Has multiple languages outside of English or what was available in the validation set.
| Column | Description |
|---|---|
| Comment_text | Contains the string that represents the comment. |
| Lang | Two letter representation of the language of the comment. 'es'= Espaniol, 'it' = Italian etc. |
Methodology
I employed transfer learning here. Which means I made use of a model that is pretrained at language comprehension and trained it to identify toxic comments. The specific model I used is Facebook’s RoBERTa which is a version of a BERT Transformer. The Transformer is a deep learning NLP model introduced in the 2017 that is able to make sense of a word within the context of the sentence, i.e., it reads the entire sentence of words from left to right as well as right to left before making final interpretations of the word.
The model consists of components called Encoder and Decoder which, well, encode words into intermediate representations, and decode this representation in a language respectively. This is precisely what makes the Transformer models multilingual. If the encoder is trained in multiple languages, they can all be reduced to the same intermediate representation, further the Decoder can be used to output a whole different language thus enabling the Transformer to be used as a translation tool. More specific to our problem, this feature is what let’s us get away with using an all English training dataset to classify toxic comments from other languages. The Transformer has already been trained to interpret the different languages in our test and validation sets.
Results
I was able to achieve a test accuracy of 92.9%.
3. USA Foreign Trade Analysis
Here is the link to the notebook hosted on github but opened through NBViewer. Here is the Github link. I’ve also developed a dashboard using this data on Tableau and hosted it publicly here. It consists of commodity level, country level views of trade value as well as rankings.
Introduction
International trade has been since ancient times and continues to be today, one of the largest cogs of the economy that propels industries forward. Trade ties make or break an economy. I find the complexity of trade fascinating and wanted to look into how US foreign trade has varied over time. This is an exploratory analysis conducted for the years 1998-2018.
Datasets
- US Trade Data - from USA Trade online hosted by the US Department of Commerce. Note: The category of the goods being traded are sort of broad and usually do not mention the exact product. For example, ‘Automotive
- USD CPI Data - from the Bureau of Labor Statistics website hosted by the United States Department of Labor. I used the CPI data to adjust for inflation throughout these 20 years by setting the trade value to the dollar value of latest month in the dataset.
Insights
The analysis was done around trade value and not trade volume.
| No. | Insight |
|---|---|
| 1 | Trade is usually bilateral with all countries, however there are a few countries which during certain years have imported from, but not exported goods to the US or vice versa. |
| 2 | All categories of goods except one are both imported and exported. |
| 3 | There has always been a trade deficit, i.e., total imported value is always higher than total exported value. |
| 4 | There is a prominent dip in imports and exports around the 2009 recession. |
| 5 | Nuclear Reactors, Boilers, Machinery etc. parts is the highest value import and export throughout the duration, except during the 2000-2010s where it is second in the imports. |
| 6 | Pharmaceutical imports have climbed several ranks between the 2000s and the 2010s. |
| 7 | Mineral fuel exports have seen a substantial rise from the 90s to the 2010s |
| 8 | China, Canada and Mexico rank 1st, 2nd and 3rd among the countries the US imports from. |
| 9 | China has climbed the ranks to number 1 for imports from number 4 over these 20 years. |
| 10 | Canada, Mexico and China rank 1st, 2nd and 3rd among the countries the US exports most to. |
| 11 | The US exports to China considerably lower total value of goods than she imports from her. |
4. Kickstarter Campaign Success Prediction
This was a collaborative project I worked on along with Utkarsh Singh, Soumya Halder, Saurabh Wani and Rinisha Marar. Link to the Github portal.
There are three python notebooks for this project.
- Part 1 - Wrangling, EDA, Logistic Regression and Neural Networks
- Part 2 - Text Mining, Bag of Words Generation, Naive Bayes Classifier
- Part 3 - Decision Trees and Random Forest
For more details please refer to our Final Report or our Slideshow with Narration.
Introduction
Kickstarter, launched in April 2009, is an online crowd-funding platform for entrepreneurs to raise funds from the online community. Campaigns are intended to turn ideas into reality. The objective of this project was to predict the outcome (success/failure) of a campaign based on the available parameters post launch.
Datasets
We got our campaign data from Web Robots, a website where several datasets are scrapped off the internet and made available to the public.
Methodology
We tried out several models - Logistic Regression, Naive Bayes Classifier, Decision Trees, Random Forest and Neural Networks. There is an in depth performance comparison in the report and the slides. We also generated a bag of words and fed this into our models which lifted our model accuracy and sensitivity.
Results
Our Random Forest model had the best overall accuracy, i.e. a value of 75%.